TNO
May 12, 2014
White people have been ethnically cleansed from the city of Chicago—a fact evidenced by the 2010 US Census, which revealed that the “white non-Hispanic” population stood at only 31 percent in 2009.
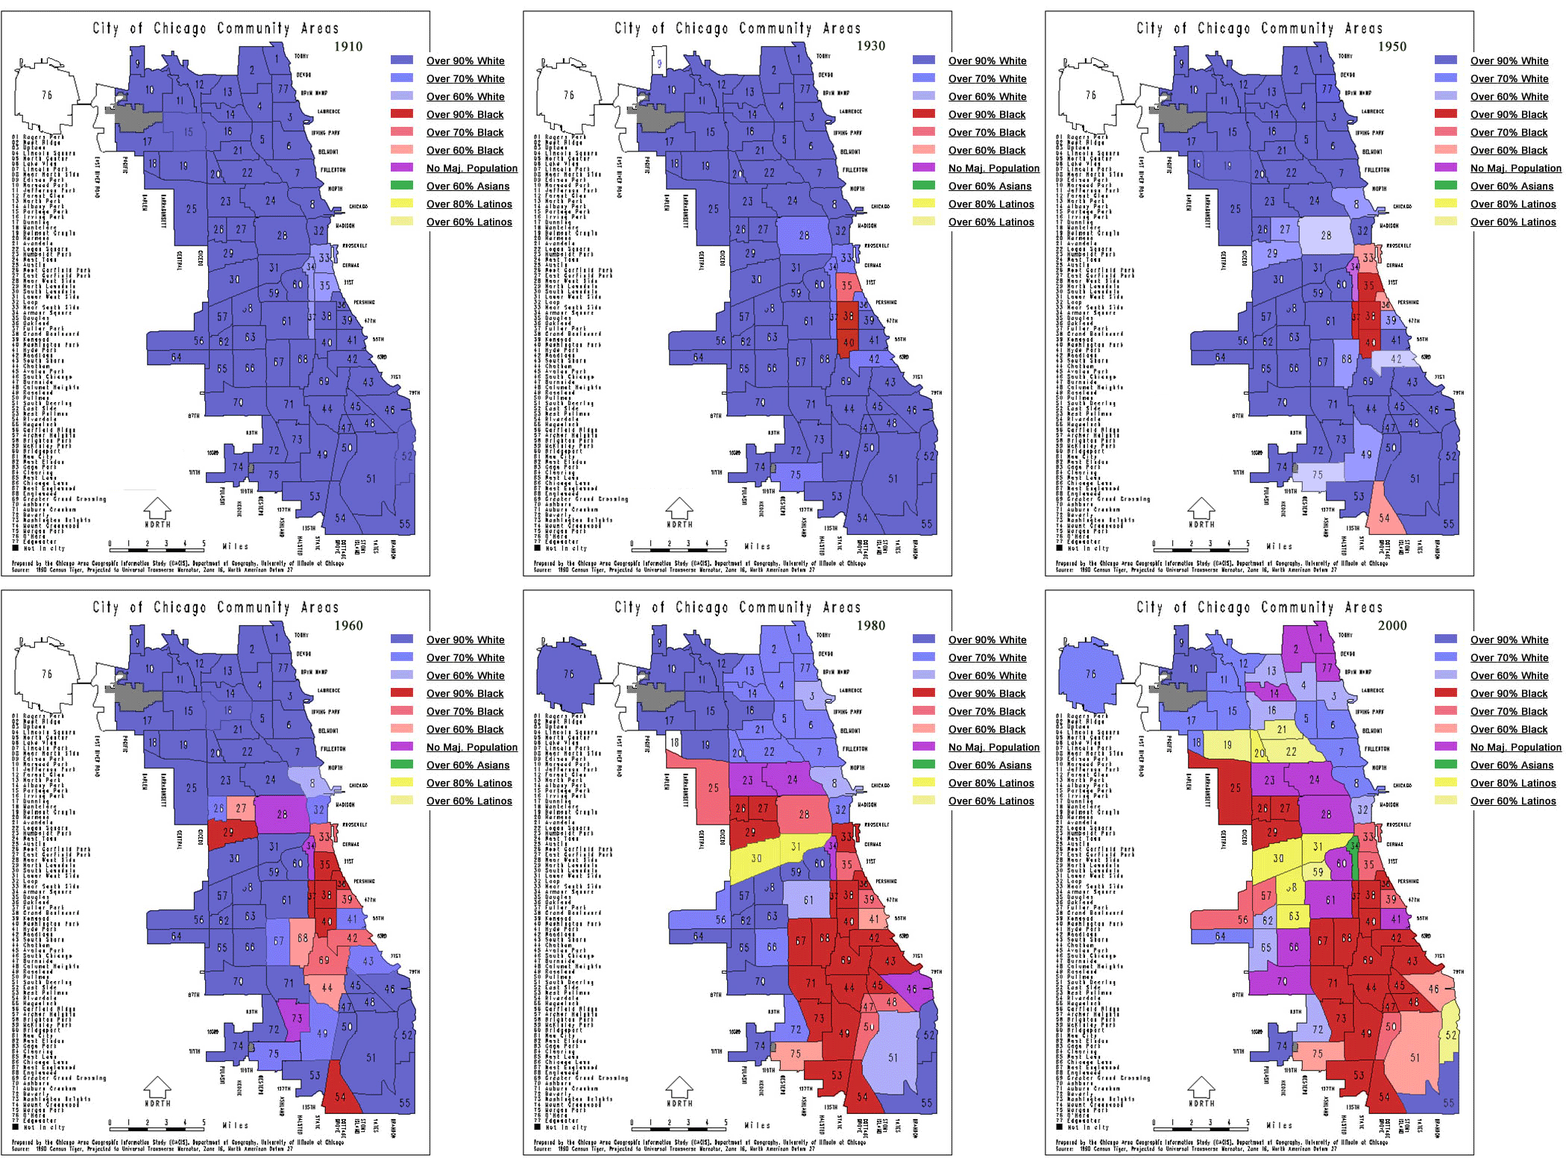
Now, a new graphic has been released which shows precisely how whites have been driven out of the city during the last 100 years.
According to the 2010 census, the racial makeup of the city in 2010 was 32% black (including Hispanics), 45% white (31% non-Hispanic white + 14% white Hispanics), 5% Asian (including Hispanics), and 3% from two or more races (including Hispanics).
Even these figures are doubtless incorrect, as the US Census Bureau counts all Middle Easterners and North Africans as “white”. In addition, the US Census Bureau relies on a self-classification method of racial identification.
Chicago has the fifth highest foreign-born population in the United States.
Another graphic, this time using median family income as its yardstick, shows how what it calls the “Middle Class” have vanished from the city.
There is, of course, a direct correlation between the “vanishing” of the middle class and the ethnic cleansing of whites from the city—the second largest in the US.
The grey squares, which illustrate the middle class that dominated most of the city’s neighborhoods in 1970s, quickly vanish over 40 years.
The “poor,” represented by the orange and red colors, explode across the map.
 Daily Stormer The Most Censored Publication in History


