
Atlantic Centurion
August 12, 2016

Something I have written about time and time again is the issue of White demographic decline in the United States. There are a myriad of reasons for this, but before anyone can even get to why, they need to take stock of what is actually happening and assess the damage. And to get there in the first place, they have to care about it. Without racial consciousness, the entire project of White nationalism is lost.
One motivation that is often pathologized and viewed as a neurotic or weak is fear. How fear is understood varies. One could take a cautious person, or someone with a low time preference, or someone who believes in stability over risk, and belittle them as frightened and fearful. But fear is powerful, because it is the desire to avoid, for lack of a better phrase, bad outcomes. Is there an outcome worse than extinction?
The reason I harp so much on the demographic question is because I don’t want my descendants to have fight their last stand in the woods of Vermont.
Well, that’s a silly thing to say, isn’t it? What are you even talking about? Last stand? What, you think you’re going to get wiped out? Just because America is becoming a non-white majority society doesn’t mean you are being exterminated. I mean sure, you’ll be outnumbered and deprived of political and socio-economic power, but like, what are you, a racist? That’s just a reflection of our global and diverse world. And sure, you are already hated for being a heterosexual White male oppressor and people who feel this way politically are poised to be permanently in power within a few decades, but like, too bad. You’re just afraid. Also muh Indians.
Just because our ((((civil society)))) has decided that nationalism is low status and that [White] racial identity is a social construct, it does not change the fact that our in-group is being systematically replaced across this country by federal immigration laws, affirmative action policies, HUD, etc. All that is being changed is our attitude towards it. In the 1920s, Americans would have overwhelmingly and vocally opposed these changes, and no, not just in the South.
America’s demographic changes are real, and they are celebrated by the Democratic party, which believes it will get a permanent majority at the federal level and in many states once it becomes impossible to elect Republicans due to a dwindling White population. This is something which should certainly give all conservatives and Republicans a reason to pause when thinking about the immigration and race-relations debates in this country, and something every White person should at least be aware of so they can have an informed opinion on their destiny as a people on this continent.
The States
Below are some maps I have created from the 2010 US Census, and a subsequent 2011 report issued by the Census Bureau. These official federal documents contain two crucial data sets: 1.) the percentage of the officially-termed non-Hispanic white population in each state, and 2.) the percentage of births to non-Hispanic white couples. N.b. I strongly prefer to use the term Anglo-American to refer to English-speaking White Americans over non-Hispanic White, though here I will use the term Anglo White for obvious clarity.
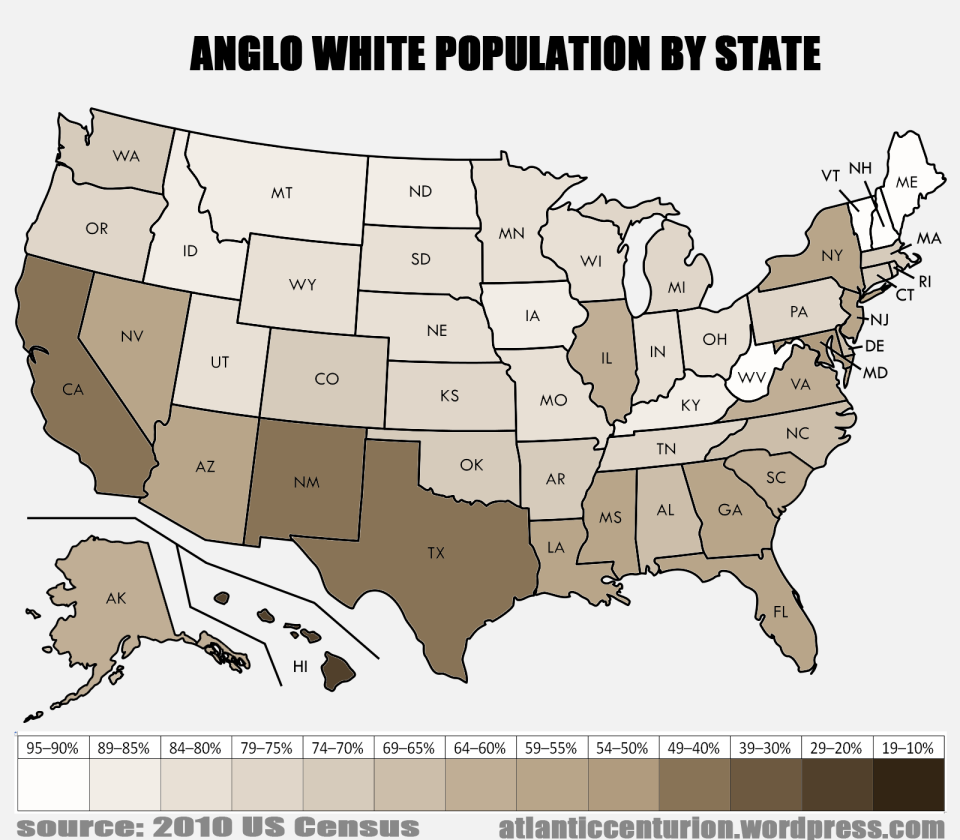
This is the White population of each state. As you can see, the interior of the country is obviously more European than the coasts, the Southwest, and the black belt states (which now have growing mestizo populations as well).
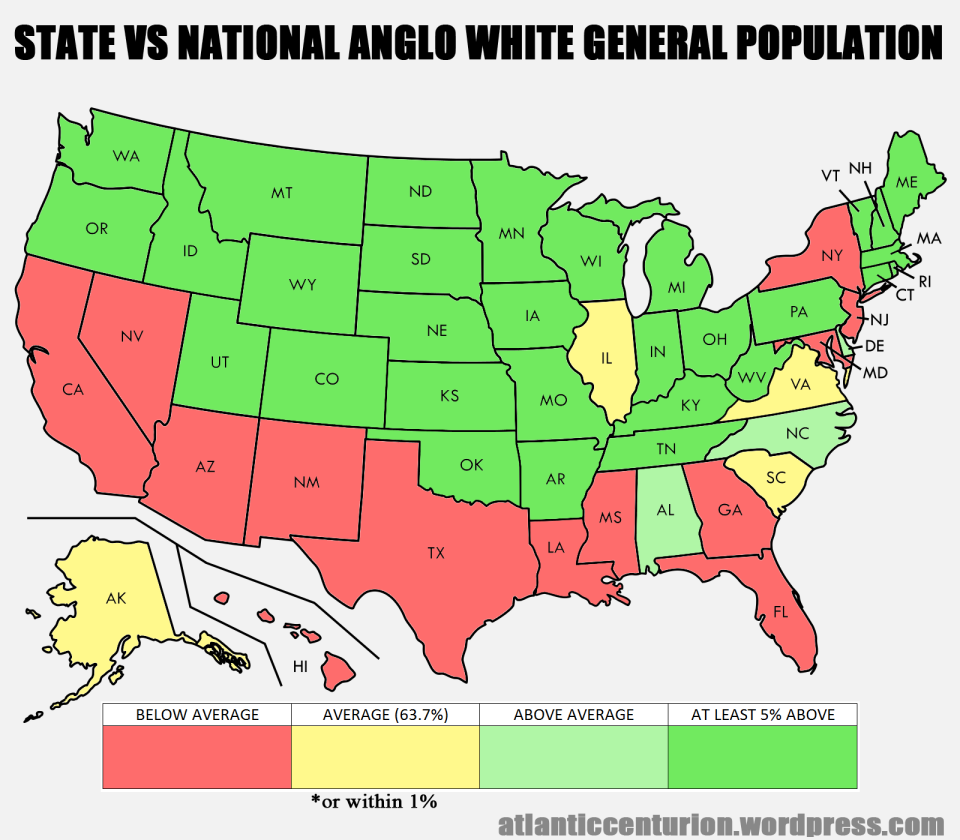
Here is how states’ White populations stack up to the national White population, which was 63.7% last Census (and by now is probably almost 60%). At 56.4%, Florida is below average, while at 92.3%, New Hampshire is above.
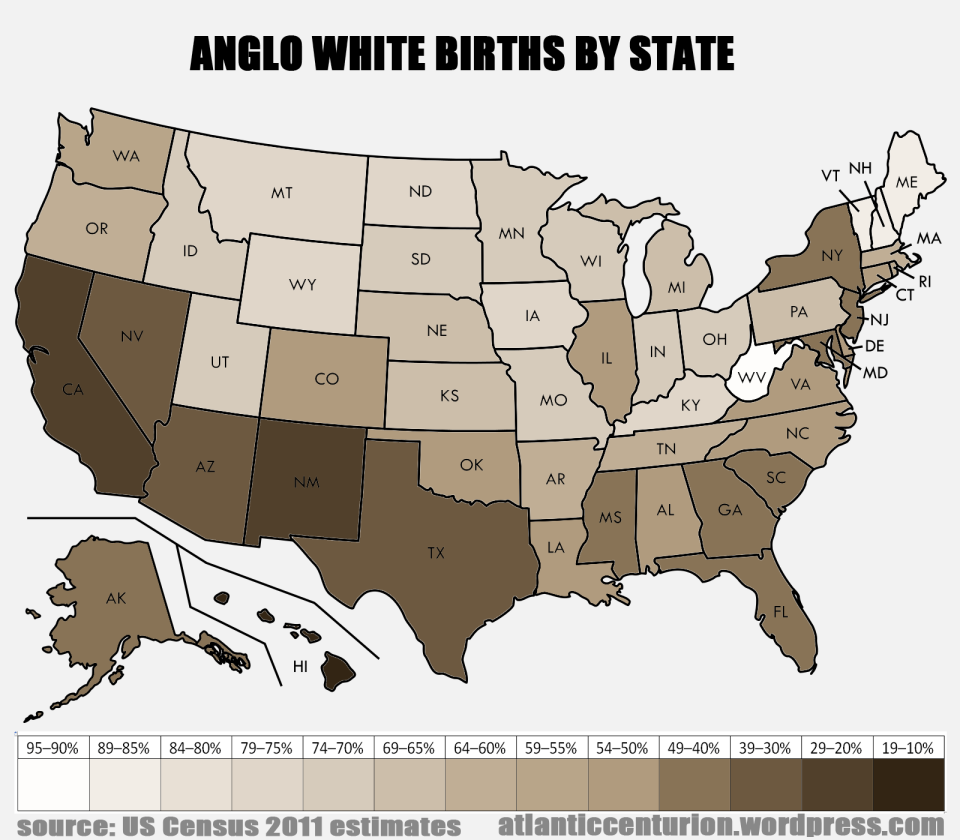
The blackest of demographic blackpills is that in pretty much every state the share of White births is typically double digits beneath that of the adult White population. So if you live in a state like 76.4% White Rhode Island, in a few years you might feel like you see a lot more non-white children then there should be, because only 59.7% of births were to White couples.
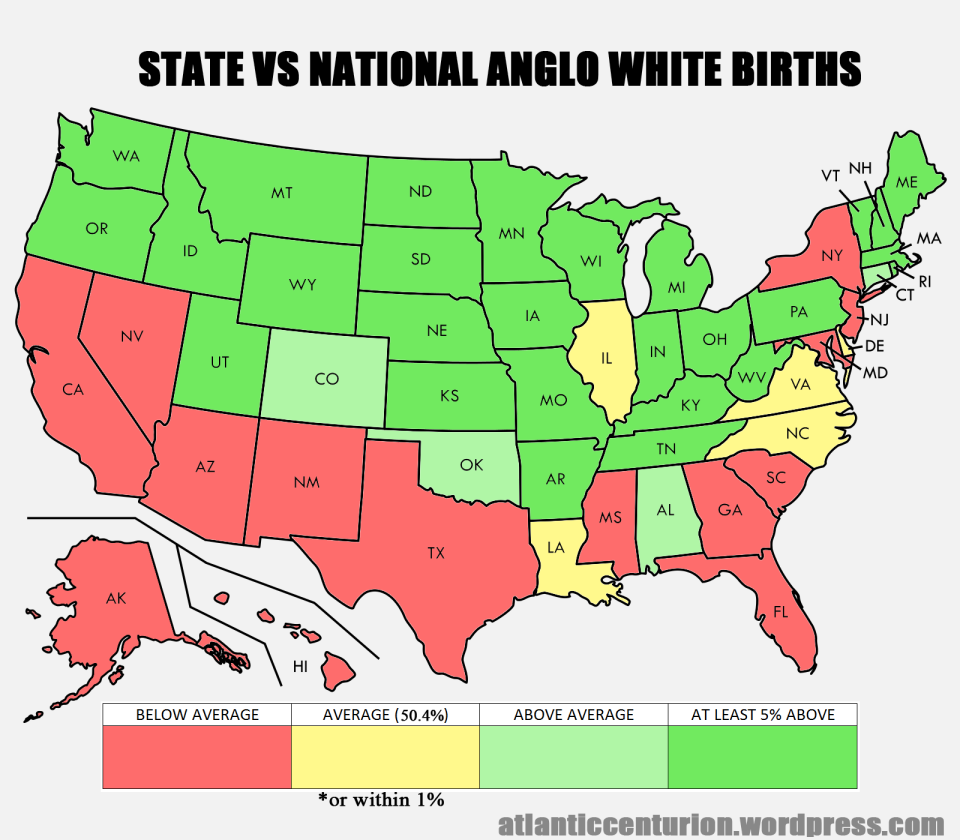
Here is how states’ White births stack up to national White births, which was 50.4% last Census, and widely reported a couple of years ago to have dipped under half. At 43.6%, New Jersey is below average, while at 63.7%, Tennessee is above average
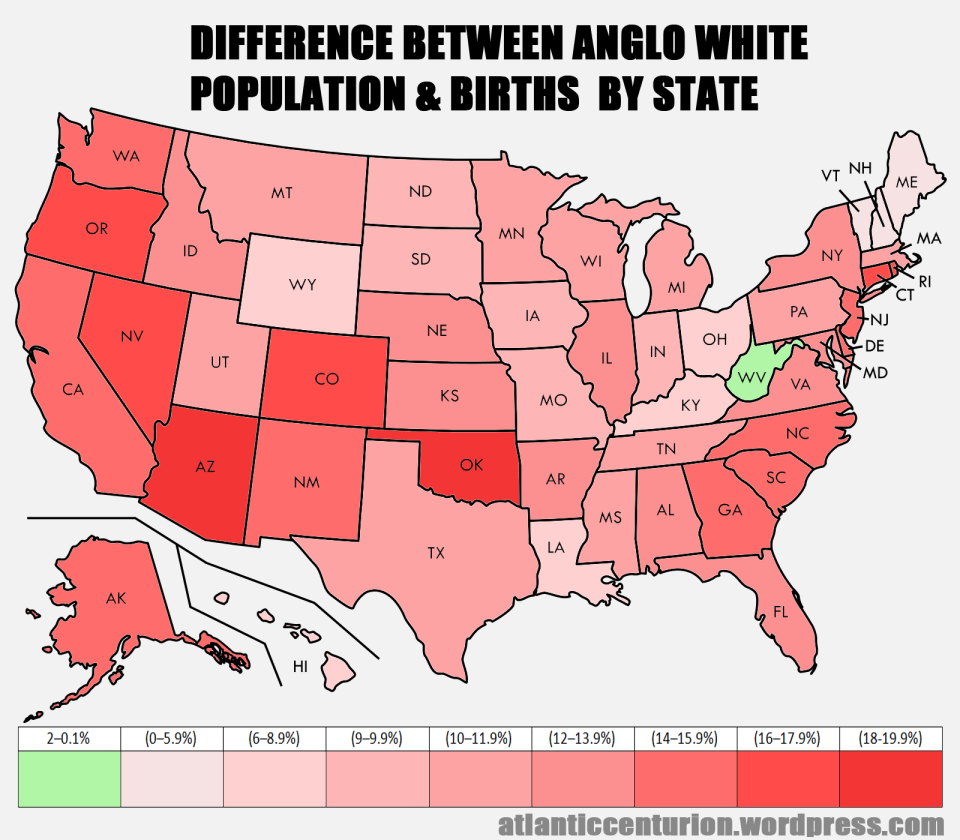
This map shows the gap between the White population and White births in each state. As you can see, literally only one state has more White births than general White population. That state is backcountry West Virginia, where a 93.2% White population has 95.2% White births, both of which are hugely above the national average as shown in the earlier maps. Other states have have been hit much harder for a variety of reasons, but mostly because the “breeding” age population is less White than the general population, especially in the newer immigration magnet states. So for example, the change is actually greater in places like Oklahoma (-19.5%) or Connecticut (-17.1%) than somewhere you might expect like Texas (-10.3%) or New York (-13.9%), as immigration from the third world is reaching more and more states.
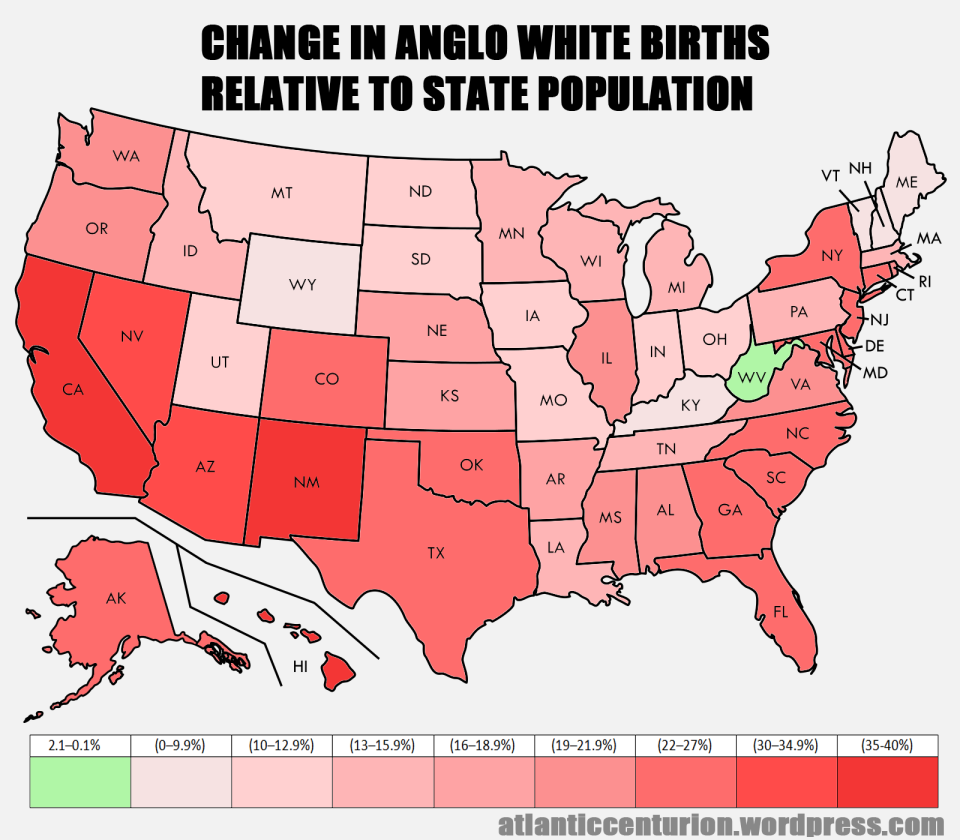
Oh look, it’s West Virginia again. This map is a bit less intuitive than the others but reflects how once the White population stops being a super-majority, it becomes much more sensitive to further demographic changes. Take the example of minority-majority California, where Whites are 40.1% of the population and 24.9% of births. Out of the total state population, that’s a decline of 15.2%. What this map shows, however, is White births relative to the White population. A change from 40.1% to 24.9% is, relatively speaking, a 37.9% drop. So California becomes about a sixth less White as a result of there being over a third less Whites born. In other words, in places where White minoritization is the most advanced it only accelerates further. Hawaii is a similar case: 22.7% White, 14.5% White births, a -8.2% difference between general population and births, and -36.1% change in Whites. A smaller population feels demographic shifts much more quickly; hence the coasts and the border are in the red. On the East Coast in particular, there is basically a long unbroken chain of states with a -20% change or worse. Talk about a great replacment.
One use of this information—though you will need to do your own labor and economic research—is insight into where you should aim to migrate to or start a family, if you are in one of the non-white or soon-to-be non-white states. On paper—and only looking at percentile demographics—the highest potential areas are northern New England and West Virginia. There are other states where a large enough ‘White flight’ could sway things safely in our favor, especially where the share of White births are still in the seventies or better. If I had to pick one state I really think we should target based on racial demography and geography alone, it would be Massachusetts. While its White births are in the sixties rather than seventies or better, it contains a major port city, and is connected to the lily White preserve of northern New England, a region almost untouched by non-white immigration. Make no mistake, if we do not colonize what’s left of New England, someone else will, because as the alt-right has consistently observed, non-whites love moving to White areas if they are allowed to. Ditto for the Pacific Northwest and its proximate White interior.
Percentages alone, however, do not tell the entire story. Another issue to consider is that many of the states with good or salvageable percentages have lower total state populations in general compared to the states with bad or currently unsalvageable percentages. It is debatable whether or not this will be good or bad in the long run; certainly from a democratic perspective this spells doom, but logistically speaking, smaller numbers are easier to, shall we say, work with in the event of a disaster. Much easier to supply and feed, and more mobile. The existing small, homogeneous populations are ones that could be readily colonized by White nationalists and converted, which must happen if we want to secure at least one region of the Empire for ourselves. Its voting power would, of course, be hugely impaired, unless it managed to produce a senator from our tribe (I know, >implying the United States will keep the small, White state favoring Senate as it becomes more diverse).
On the other hand, just because a very populous state is not very White does not mean it has few White people in it. There are more Whites in New York than in all of Vermont, more in California than West Virginia. But to live in one of these places is to live under double occupation, both federal and state/local. It is also very expensive if one also wants to avoid their replacements (I know, >implying HUD won’t target your little community for enrichment). But US states, with political boundaries drawn over a hundred years ago, are only half the story.
The Cities
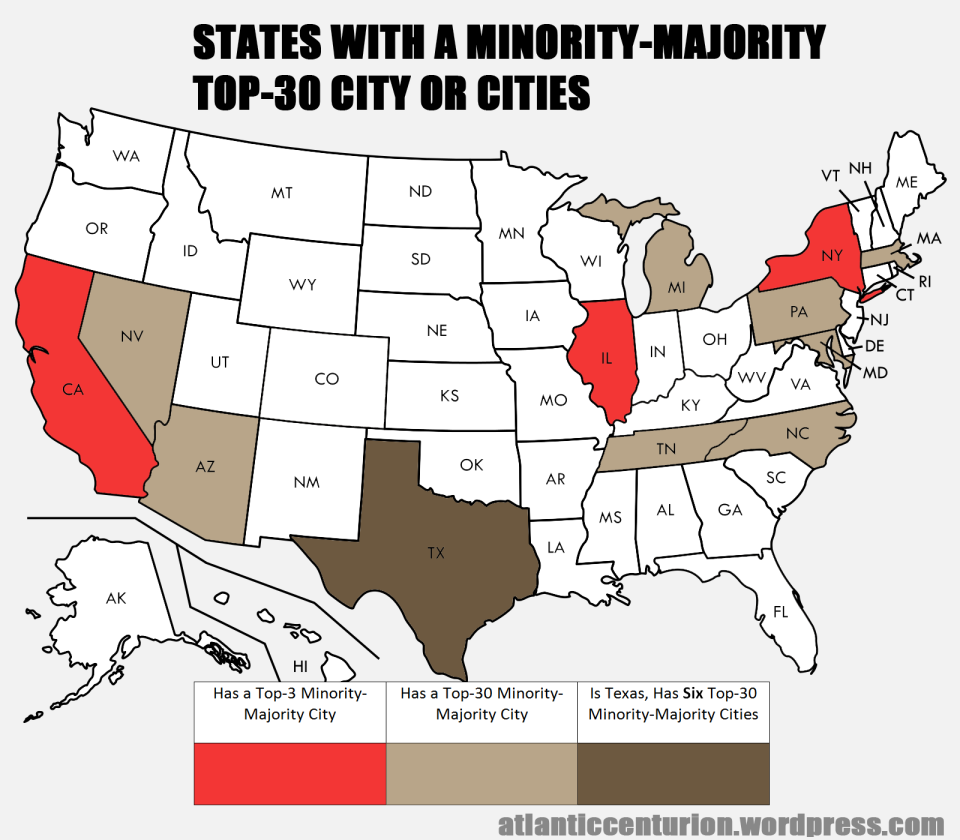
The American city has borne the brunt of demographic colonization by the third world. In total, less than a third of the thirty largest US cities proper have a White majority, None of the ten largest cities have a White majority. In the top three—New York, Los Angeles, and Chicago—Whites are less than a third of the population. Five of the top-twenty cities have a White majority, but only one is over 60% White. With all thirty included, nine have a White majority—Jacksonville, Indianapolis, Columbus, Seattle, Denver, Nashville, Portland, Oklahoma City, and Louisville—but only three—Seattle, Portland, and Louisville—are over 60% White. All three over-60% cities have less than 700,000 people, and the general trend is that smaller cities tend to be Whiter. Outside of the top-thirty however, there are plenty of cities proper that counter this trend and have minority-majorities, such as Atlanta, Sacramento, Miami, New Orleans, Cleveland, Tampa, St. Louis, Cincinnati, and Newark to name a few.
Someone I bounced the city numbers off before publishing this suggested I look into the metropolitan population statistics rather than only those of the cities proper. This is because cities proper often do not reflect the actual demographics of urban areas in some cases. For example, minority-majority Miami doesn’t make the top-thirty largest cities but is the ninth largest (and still a minority-majority) metropolitan area. Similar is minority-majority Tampa, which has the twenty-second largest metro area, and flips to being White-majority by a high margin if all of Tampa Bay is counted despite being a non top-thirty city. Detroit becomes White-majority when its suburbs are counted. Cities like New York, Los Angeles, and Chicago remain unchanged in rank when their metro areas are counted, but by including their suburbs also become Whiter, with New York at 45.3%, Los Angeles at 39.0%, and Chicago inching into a majority at 52.8%. Three of the top ten metro areas have White majorities—Chicago, Boston, and Dallas–Fort Worth—but none are higher than the low 50s. Twenty of the top-thirty have White majorities, but only nine are at or above the national White population of 63.7%—Seattle, Minneapolis/St. Paul, Cleveland, Portland, St. Louis, Tampa, Pittsburgh, Charlotte, and Salt Lake City. For some of the other Metropolitan Statistical Areas or Combined Statistical Areas I looked into, I could not easily find the ethnographic breakdown beyond just the city proper or the major county, but I would assume a similar trend. Ultimately, this just drives home the point further that cities and metropolitan areas are being demographically conquered and expanding deeper into the country.
And from the maps I provided above, it is clear that the coastal and border regions of the United States, home to our largest cities and power centers, seem destined to become solidly non-white, leaving a large but relatively sparse—and therefore colonially vulnerable—interior region as the only place with a large White majority. The United States is reverting to a colonial society, one of foreign cities and a disconnected indigenous countryside. We’ve become the Indians.
This is a problem. Cities are the focal points of social and financial mobility in the United States, centers of political power, and where high status is conferred upon people, something normies crave. That we are becoming physically and culturally excluded from this world I think is a net negative, despite much of the alt-right’s hostility to urban life. Indeed, how much of that hostility is an indictment of the demographics of cities and their derived politics rather than of the physical spaces of the cities themselves? Our situation is a perverse one, one in which our cities are foreign to us even though urbanization is an integral part of modernity.
The idea that we can abandon our own cities for farther and farther away suburbs, a phenomenon which has been going on for decades, is one whose time is going to be cut short sooner or later by the simple reality that ordinary people cannot afford to move away from jobs. Not to mention that we will run out of land eventually. At this point it is a game of chicken with (((international financial capitalism))) to see whose rotten undergirding falls out first—do the cities collapse under their own dead weight as a result of our flight and replacement with net tax-consuming vibrants, or do we become impoverished in the long-run as a result of unplugging ourselves from “where the money is”?
For the foreseeable future, we will continue to have a racially-driven reverse movement of people out of cities into the hinterland. Traditionally, cities were grown from the countryside as people migrated to them in search of opportunity and employment. Our ongoing revolt against the flow of history does not stop urbanization, however. Instead of our own countryside fueling the growth of our cities, it is migration from the global south, which exacerbates White flight further. Is there really any good reason why unemployed or underemployed native English speakers from say, the Rust Belt, couldn’t be encouraged to move to our cities for work? Why instead import what are largely foreign functional illiterates?
The so-called global city is really just a third world colony in the White world. Colonization is not just a metaphor for the current state of affairs, it is the reality of them. How did European colonists live outside of Europe during our high tide? They lived in and built fortified cities and ports in foreign lands where they were a minority. Today it has been reversed; we are the ones living beyond the Pale, watching ivory towers filled with ebony rise in our conquered capitals.
The loss of our own cities is unique problem of the White world, the sort of thing Stoddard warned us would happen if we yielded the outer dikes without shoring up the inner dikes. A Japanese city is Japanese. A Mexican city is Mexican. An Indian city is Indian. A Chinese city is Chinese. It is only in Europe and the Anglo satellites where you have this phenomenon of cities being not just slightly divergent from the general population but foreign to it. New York, for example, is not an Anglo-American city, but an Israeli-Puerto Rican-Chinese-Pakistani-Ecuadorian-Mexican-Filipino-Dominican-African-Korean city. Paris is not a French city, but an Algerian-Moroccan-Portuguese-Senegalese-Vietnamese-Malian city. London is not a British city, but an Indian-Pakistani-Jamaican-Polish-Bengali-Arab-Chinese-Nigerian city. It will pose a geopolitical problem in the future, that metropolitan and non-metropolitan counties in the same country are different races from one another. Indeed, there can be no harmony in a country where the centers of power and economic life are radically different from the wider society—the ancient tension between urban and rural will only be exacerbated further.
Is there a silver lining to what is happening to the American city? One may be that the trend of White flight reflects a rising racial consciousness among our people, a necessary transformation. But it isn’t enough to simply flee aimlessly into the interior only for the sake of negating demographic change in one’s former residence. Without a constructive project, without the goal of building a new and resilient tribal order, we only buy ourselves another decade until the inevitable rising tide reaches the boardwalk and we are forced to find higher ground.
On the other hand, in a lot of occupied cities there is a growing din of complaints about gentrification—what happens when too many Whites move into a neighborhood for “non-Asian minorities” to afford living there anymore. If we want to extend the colonial analogy, we are the indigenes who require papers from our colonizers for the privilege of moving from one section of the colony to another; freedom of movement is a thing of the past. We are damned if we do and damned if we don’t. If we leave the cities we are castigated for our “racism”; if we move in we are destroying a monoracial vibrant community.
The neo-gentry would be mortified at accusations of racism. Many of these transplants are extremely liberal on arrival, and lack a strong racial consciousness. But they are an improvement demographically, and over time they may notice a certain pattern as to what groups are impeding them from “beautifying” their new neighborhoods. Perhaps the struggle for the hearts and minds of our people won’t be fought in the backcountry, but in the back of Whole Foods.
One last note on the issue of having foreign cities in one’s own country—the cosmopolitan elites will ultimately have to reckon with the reality that their position is precarious. Since 1945, the dominant pattern in most of the world, that is to say the non-white world, has been the expulsion and repatriation of most foreign colonizer minorities from urban centers, followed by massive civil unrest or military conflict as the resurging society struggles to organize itself indigenously and carve a new place in the international order. The notion of American exceptionalism will be put to the test in this regard. The experiences of the Afro-Asiatic world, in places as far-flung as Egypt, India, Pakistan, Indonesia, Algeria, Vietnam, Angola, Mozambique, Bangladesh et al., did not happen in a vacuum. Is it so unreasonable to think the Anglo-European world is not immune?
Consider Egypt as an example. After Napoleon invaded the Ottoman province in the 1790s, Egypt became increasingly important to European imperialists as a strategic prize in the Orient. Less than a hundred years later, an Anglo-French company had built the Suez Canal, and Britain had created a client state out of the Ali dynasty in Egypt, which along with its ruling court was ethnically of Albanian and Turco-Circassian extraction. Egypt was an undeveloped country and integration into the British empire as a waystation to India meant it became an attractive site for enterprising businessmen and bourgeois adventurers from all over Europe and the Mediterranean. The development of Egypt’s chief cities—Cairo and Alexandria—and much of their economic activity fell into the hands of a large assortment of foreigners who had zero intention of becoming Arabized and Islamicized members of Egyptian society. English, French, Jewish, Italian, Greek, Belgian, and even Armenian and Syrian people migrated to Egypt and most of the country’s wealth creation and business management was in their hands for decades, excluding the overwhelming majority of native Egyptians from this development process. And so by the 1960s this disparity had reached a fever pitch—after Egypt’s independence from Britain, the ascension to power of the hinterland-born Arab nationalist Gamal Abdel Nasser, the nationalization of the Suez Canal by the Egyptian state, and the war with Israel, virtually the entire foreign resident minority community of Egypt had fled or been forcibly expelled from the country. What happened? Egyptians rejected the idea that the Egyptian city was actually a British-French-Israeli-Italian-Greek-Belgian-Armenian-Syrian city.
People do not like being colonized. And that emotion has a world-historical trend of overriding the concerns of both Homo economicus and of the colonizers, no matter how benign they try to reinvent themselves to be as the crisis worsens. The foreign resident minorities of our cities have countries to go back to, just as their counterparts did in Egypt. It takes no stretch of the imagination to think it could happen here, just ignorance to deny it.
So should we be concerned about our ongoing replacement and the mirth of our hostile government? Yes. Are we cowards for doing so? No, we are the bravest of our race.
Reference
Here are the numbers I used to produce the above charts. The general population and children-under-one are overwhelmingly drawn from the 2010 US Census and a 2011 estimate by the Census Bureau, respectively. A handful are from official estimates conducted during other year. These variations do not change the overall trend, that demographics have been transformed as a result of the 1965 ((((Hart-Celler Act)))). While there is probably newer data for many of these states, it would not be as official or uniform as the Census, and it would be from too wide a set of years for a good comparison. What I have collected here is essentially a snapshot of the country in 2010—it is safe to say the current year probably looks worse.
| Abbreviation | State | %White gen. pop. | %White under age 1 | Difference b/w births and pop. | Change in births rel. to pop. |
|---|---|---|---|---|---|
| US | United States | 63.7% | 50.4% | -13.3% | -20.9% |
| AK | Alaska | 64.1% | 49.3% | -14.8% | -23.1% |
| AL | Alabama | 67.0% | 53.4% | -13.6% | -20.3% |
| AR | Arkansas | 74.2% | 61.0% | -13.2% | -17.8% |
| AZ | Arizona | 57.8% | 38.7% | -19.1% | -33.0% |
| CA | California | 40.1% | 24.9% | -15.2% | -37.9% |
| CO | Colorado | 70.0% | 54.0% | -16.0% | -22.9% |
| CT | Connecticut | 71.0% | 53.9% | -17.1% | -24.1% |
| DE | Delaware | 65.3% | 50.3% | -15.0% | -23.0% |
| FL | Florida | 56.4% | 43.0% | -13.4% | -23.8% |
| GA | Georgia | 55.9% | 41.2% | -14.7% | -26.3% |
| HI | Hawaii | 22.7% | 14.5% | -8.2% | -36.1% |
| IA | Iowa | 88.7% | 79.7% | -9.0% | -10.1% |
| ID | Idaho | 85.5% | 72.8% | -12.7% | -14.9% |
| IL | Illinois | 63.7% | 50.6% | -13.1% | -20.6% |
| IN | Indiana | 81.3% | 71.8% | -9.5% | -11.7% |
| KS | Kansas | 77.5% | 65.0% | -12.5% | -16.1% |
| KY | Kentucky | 86.3% | 78.7% | -7.6% | -8.8% |
| LA | Louisiana | 59.3% | 51.0% | -8.3% | -14.0% |
| MA | Massachusetts | 73.7% | 63.6% | -10.1% | -13.7% |
| MD | Maryland | 54.7% | 42.0% | -12.7% | -23.2% |
| ME | Maine | 94.4% | 89.0% | -5.4% | -5.7% |
| MI | Michigan | 76.6% | 65.7% | -10.9% | -14.2% |
| MN | Minnesota | 83.1% | 72.3% | -10.8% | -13.0% |
| MO | Missouri | 81.0% | 71.9% | -9.1% | -11.2% |
| MS | Mississippi | 58.0% | 46.2% | -11.8% | -20.3% |
| MT | Montana | 87.8% | 77.6% | -10.2% | -11.6% |
| NC | North Carolina | 65.3% | 50.2% | -15.1% | -23.1% |
| ND | North Dakota | 88.7% | 79.3% | -9.4% | -10.6% |
| NE | Nebraska | 82.1% | 69.0% | -13.1% | -16.0% |
| NH | New Hampshire | 92.3% | 85.2% | -7.1% | -7.7% |
| NJ | New Jersey | 58.9% | 43.6% | -15.3% | -26.0% |
| NM | New Mexico | 40.5% | 25.0% | -15.5% | -38.3% |
| NV | Nevada | 54.1% | 36.4% | -17.7% | -32.7% |
| NY | New York | 58.3% | 44.4% | -13.9% | -23.8% |
| OH | Ohio | 81.1% | 72.4% | -8.7% | -10.7% |
| OK | Oklahoma | 72.2% | 52.7% | -19.5% | -27.0% |
| OR | Oregon | 77.8% | 61.3% | -16.5% | -21.2% |
| PA | Pennsylvania | 79.2% | 67.9% | -11.3% | -14.3% |
| RI | Rhode Island | 76.4% | 59.7% | -16.7% | -21.9% |
| SC | South Carolina | 63.9% | 48.1% | -15.8% | -24.7% |
| SD | South Dakota | 83.8% | 74.6% | -9.2% | -11.0% |
| TN | Tennessee | 75.4% | 63.7% | -11.7% | -15.5% |
| TX | Texas | 45.3% | 35.0% | -10.3% | -22.7% |
| UT | Utah | 81.4% | 71.4% | -10.0% | -12.3% |
| VA | Virginia | 63.1% | 50.9% | -12.2% | -19.3% |
| VT | Vermont | 94.3% | 88.9% | -5.4% | -5.7% |
| WA | Washington | 71.0% | 55.7% | -15.3% | -21.5% |
| WI | Wisconsin | 83.3% | 72.5% | -10.8% | -13.0% |
| WV | West Virginia | 93.2% | 95.2% | 2.0% | 2.1% |
| WY | Wyoming | 82.9% | 75.1% | -7.8% | -9.4% |
Here are the stats for America’s thirty largest cities*, from New York, NY at 8,550,405 souls to Louisville, KY at 615,366:
| Pop. Rank | City | State | Pop. | % White |
|---|---|---|---|---|
| 1 | New York | NY | 8,550,405 | 18.7%* |
| 2 | Los Angeles | CA | 3,971,883 | 28.70% |
| 3 | Chicago | IL | 2,720,546 | 31.70% |
| 4 | Houston | TX | 2,296,224 | 25.60% |
| 5 | Philadelphia | PA | 1,567,442 | 36.90% |
| 6 | Phoenix | AZ | 1,563,025 | 46.50% |
| 7 | San Antonio | TX | 1,469,845 | 26.60% |
| 8 | San Diego | CA | 1,394,928 | 45.10% |
| 9 | Dallas | TX | 1,300,092 | 28.80% |
| 10 | San Jose | CA | 1,026,908 | 28.70% |
| 11 | Austin | TX | 931,830 | 48.70% |
| 12 | Jacksonville | FL | 868,031 | 55.10% |
| 13 | San Francisco | CA | 864,816 | 41.90% |
| 14 | Indianapolis | IN | 853,173 | 58.60% |
| 15 | Columbus | OH | 850,106 | 59.30% |
| 16 | Fort Worth | TX | 833,319 | 41.70% |
| 17 | Charlotte | NC | 827,097 | 45.10% |
| 18 | Seattle | WA | 684,451 | 66.30% |
| 19 | Denver | CO | 682,545 | 52.20% |
| 20 | El Paso | TX | 681,124 | 14.20% |
| 21 | Detroit | MI | 677,116 | 7.80% |
| 22 | Washington | DC | 672,228 | 35.80% |
| 23 | Boston | MA | 667,137 | 45.90% |
| 24 | Memphis | TN | 655,770 | 27.50% |
| 25 | Nashville | TN | 654,610 | 56.30% |
| 26 | Portland | OR | 632,309 | 72.20% |
| 27 | Oklahoma City | OK | 631,346 | 56.70% |
| 28 | Las Vegas | NV | 623,74 | 47.90% |
| 29 | Baltimore | MD | 621,849 | 28.00% |
| 30 | Louisville | KY | 615,366 | 71.70% |
*Population rank based 2015 estimates by the United States Census Bureau. Percentages based on whatever numbers available, 2010 for most and at the oldest. I am sure these numbers have not improved since, and as soon as the 2020 Census results are available we can see how further things are gone.
**Due the extraordinary contamination of (((New York))), it would have been misleading to use the non-Hispanic White percentage given by the Census alone. Instead I have calculated what the true percentage is from these numbers: 8,550,405 residents, 2,700,000 non-Hispanic Whites subtract 1,100,000 Jews.
Here are the stats for America’s thirty largest metropolitan areas*, from New York at 23,462,099 to Las Vegas at 2,247,056:
| Pop. Rank | Metro | State(s) | Pop. | % White |
|---|---|---|---|---|
| 1 | New York metropolitan area | NY-NJ-CT-PA | 23,462,099 | 45.3%i |
| 2 | Greater Los Angeles area | CA | 18,238,998 | 39.00% |
| 3 | Chicagoland | IL-IN-WI | 9,899,902 | 52.80% |
| 4 | Washington-Baltimore metropolitan area | DC-MD-VA-WV-PA | 9,331,587 | 48.2%ii |
| 5 | Greater San Francisco Bay area | CA | 8,370,967 | — (<50%) |
| 6 | Boston metropolitan area | MA-RI-NH-CT | 8,091,371 | — (>50%) |
| 7 | Philadelphia metropolitan area | PA-NJ-DE-MD | 7,449,428 | — (<50%) |
| 8 | Dallas-Fort Worth metroplex | TX-OK | 7,095,411 | 50.2%iii |
| 9 | Miami metropolitan area | FL | 6,375,434 | 34.80% |
| 10 | Houston metropolitan area | TX | 6,371,677 | 33.0%iv |
| 11 | Atlanta metropolitan area | GA | 6,092,295 | 50.70% |
| 12 | Detroit metropolitan area | MI | 5,311,449 | 59.2%v |
| 13 | Seattle metropolitan area | WA | 4,399,482 | 68.00% |
| 14 | Phoenix metropolitan area | AZ | 4,329,534 | 58.70% |
| 15 | Minneapolis-St. Paul metropolitan area | MN-WI | 3,759,978 | 76.46%vi |
| 16 | Greater Cleveland | OH | 3,497,711 | 71.70% |
| 17 | Denver metropolitan area | CO | 3,214,218 | — (>50%) |
| 18 | San Diego metropolitan area | CA | 3,177,063 | 45.1%vii |
| 19 | Portland metropolitan area | OR-WA | 2,992,924 | 76.30% |
| 20 | Orlando metropolitan area | FL | 2,920,603 | 46.0%viii |
| 21 | Greater St. Louis | MO-IL | 2,900,605 | 76.90% |
| 22 | Tampa Bay Area | FL | 2,842,878 | 76.00% |
| 23 | Pittsburgh metropolitan area | PA-OH-WV | 2,661,369 | 89.80% |
| 24 | Sacramento metropolitan area | CA | 2,462,722 | — (>50%)ix |
| 25 | Charlotte metropolitan area | NC-SC | 2,454,619 | 64.02%x |
| 26 | Kansas City metropolitan area | MO-KS | 2,376,631 | (>50%) |
| 27 | Salt Lake City metropolitan area | UT | 2,350,274 | 86.63% |
| 28 | Columbus metropolitan area | OH | 2,348,495 | (>50%) |
| 29 | Indianapolis metropolitan area | IN | 2,310,360 | 62.7%xi |
| 30 | Las Vegas metropolitan area | NV-AZ | 2,247,056 | 60.20% |
*Numbers are taken from 2012 estimates by the United States Census Bureau. Percentages based on whatever numbers available, 2010 for most and at the oldest. Some are from the 2011 American Community Survey. For cities where I could not easily find the CSA or MSA data, on the map I assumed they had a White majority. As with the city proper statistics, I am sure these numbers have not improved since, and as soon as the 2020 Census results are available we can see how further things are gone.
i (23,462,099 x 0.517) Whites subtract 1.5M Jews leads to a percentage of 45.3%, less than the Census 51.7%).
ii These are the DC metro area numbers. Can’t easily find the Washington-Baltimore numbers and don’t care. Neither city is White.
iii Includes Hispanics.
iv I used Harris County’s stats since I couldn’t find any for the entirety of Dallas–Fort Worth. The county had 4,092,459 people in 2010 according to the Census, which would make it the majority of the Houston metro area.
v Detroit’s suburbs are overwhelmingly White. The reported 70.1% seems too high, and it is, because it counts Hispanics and Arabs, who make up 6.2% and 4.7%, respectively. Subtracting these yields 59.2%
vi I used Hennepin County’s stats since I couldn’t easily find any for the whole Minneapolis–St. Paul metro. The county had 1,223,149 people in 2015 according to a Census Bureau estimate, which makes it a plurality of the Twin Cities area. Census says 80.53% without excluding the 4.07% Hispanic population, so I have subtracted it.
vii Numbers I found are for San Diego County and show the White population is 64.0% but don’t say whether or not Hispanics are included. Hispanic and Latino population is given as 32.0%. The city itself is 45.1% White so I am just going to go with that.
viii I used Orange County’s stats since I couldn’t easily find any for the whole Orlando metropolitan area. The county had 1,288,126 people in 2015 according to a Census Bureau estimate, which makes it a plurality of the area.
ix Numbers I found say 70.1% White and 15.5% Hispanic or Latino of any race. So there is a slim White majority.
x I used Mecklenburg County’s stats since I couldn’t easily find any for the whole Charlotte metropolitan area. The county had 1,034,070 people in 2015 according to a Census Bureau estimate, which makes it a plurality of the area.
xi I used Marion County’s stats since I couldn’t easily find any for the entire Indiana metropolitan area. The county had 939,020 people in 2015 according to a Census Bureau estimate, which makes it a plurality of the area.