Steve Sailer
VDARE
October 25, 2015
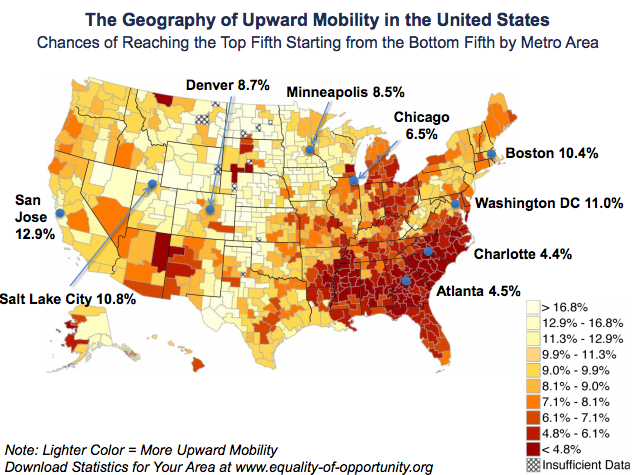
One of superstar economist Raj Chetty’s often repeated truisms growing out of his huge analysis of millions of individual income tax returns of parents in 1996-2000 and their former dependents in 2011-2012 is that the Salt Lake City, Utah metropolitan area is a great place to raise your children while greater Charlotte, North Carolina is a terrible place.
 I, personally, find things like this interesting enough to look into, although most journalists have taken Chetty’s assertions on faith.
In contrast, if the Utah Jazz were playing the Charlotte Hornets in the NBA Finals and a famous economist announced that his giant study suggested that Utah was going to win, his methodology would be subjected to in-depth scrutiny in the press. Because guys who like to think quantitatively care about predicting which city’s hired gladiators turn out to be better.
But when Chetty announces that Salt Lake City is a better place for your children’s future prosperity than Charlotte, well … he’s a MacArthur Genius and all that, so I guess his reasoning has to be bulletproof, right. And anyway, how about those Mets? And can Kansas City’s manager Ned Yost really win the World Series without prioritizing on-base percentage?
 Personally, let me add, that I don’t think I’m particularly biased in the great Salt Lake City v. Charlotte debate. I don’t recall ever having been in Salt Lake City or Charlotte other than to change planes, so I’m pretty indifferent. I would imagine I feel modestly positive about both metropolises in the abstract. I’m more of a well-wisher of Salt Lake City than I am of Las Vegas and more favorable toward Charlotte than Miami. But I don’t think I’ve ever compared Salt Lake City to Charlotte until Chetty started hammering on how one is Good and one is Bad in 2013.
Above is one of Chetty’s graphs from his presentation at the Brookings Institution. Or, for instance, in a 2014 interview with the Minneapolis Fed, Chetty said:
For example, for children growing up in places like Salt Lake City, Utah, or San Jose, California, the odds of moving from the bottom fifth of the national income distribution to the top fifth are more than 12 percent or even 14 percent in some cases, more than virtually any other developed country for which we have data.
In contrast, in cities like Charlotte, North Carolina, Atlanta, Georgia, or Indianapolis, Indiana, a child’s odds of moving from the bottom fifth to the top fifth are less than 5 percent—less than any developed country for which we currently have data.
Within the United States, there’s this incredible spectrum of variation in social mobility, which means that we shouldn’t really think of social mobility purely at the national level. Is the U.S. the land of opportunity or not? That question doesn’t really have a clear answer. Rather, we need to think about it at a much more local level and try to understand why some places have much more mobility than others and what we can do about it.
But is Chetty overlooking some basic methodological problems with his research that pop out when you actually stop and think about Salt Lake City v. Charlotte?
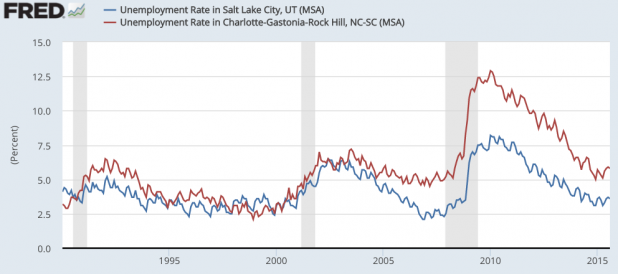
First, one methodological problem with Chetty’s attempt to figure out the long run influence of growing up in one metropolitan area rather than another is that his comparison of parents’ income in 1996-2000 versus their children’s income in 2011-2012 is sensitive to local booms and busts:
Here’s a graph of unemployment rates over the last 15 years. In 1996-2000, both Charlotte (red line) and Salt Lake City (blue line) had similarly low unemployment rates. Then they began diverging in the mid-2000s and Charlotte then got hammered by the crash of 2008, so there was a big difference in 2011-2012 when Chetty measured the next generation’s income. Since then that gap has narrowed somewhat, although by no means completely.
My guess is that while local suburban home construction traditionally plays a sizable role in both metro areas’ economies, Charlotte got hit worse by the Housing Bust because it is an economic hub of several industries that did well off homebuilding in the 1990s and early 200s, including retail banking, hardwood lumbering, and the furniture-making industry.
Housing booms tend to be good for wooded regions and Charlotte has a lot more trees than Salt Lake City.
The North Carolina furniture industry has pretty much been outsourced to Asia and it’s probably not coming back. (Here’s travel writer Paul Theroux’s pointed essay on how much economic damage outsourcing industry to Asia has done to the American South.)
Home prices in Charlotte didn’t get too out of control during the Housing Bubble, but the ambitious bank executives of Charlotte, who for decades had been creating numerous local jobs with their aggressive mergers that made Charlotte the #2 banking center of the U.S., bought the California mortgage bucketshops Countrywide and Golden West and the Wall Street dumb money operation Merrill Lynch just as the Crash was gearing up. And the locals have since paid a price in prosperity.
Now, it’s quite possible that Salt Lake City’s better economic performance in 2011-12 relative to 1996-2000 versus Charlotte’s change over the same time period reflects some deep rooted cultural or governmental difference that will continue to make SLC do well in income mobility and Charlotte do badly. Or it could be that this is heavily contingent upon the time periods Chetty happened to get his hands on the tax returns for.
I don’t know. But it would seem like a good idea fro somebody to try to find out more before President Hillary or President Jeb decides to re-engineer society based on Chetty’s pronouncements.
A second methodological problem is obvious from Chetty’s map: the red areas (low chance of a child at the national 20th percentile of income growing up in the 1990s making it to the 80th percentile as an adult in 2011-12) are pretty much where college football teams recruit cornerbacks. A lot of the change in income percentiles from one generation to the next is just random movement that can be modeled by regression toward the mean. A person around the 20th percentile in the Charlotte metro area, which is about 24% black, was more likely to be black in Charlotte than in Salt Lake City, which is of course one of the whitest metro areas in America.
I suppose it’s shockingly controversial for me to assert that blacks tend to regress toward a lower income mean than do whites, but it’s also self-evidently true. A black person at the national 20th percentile in income isn’t all that far below the black median, while a white person is substantially below the white median.
It would be a major theoretical challenge to dream up a plausible situation in which regression toward different racial means in income doesn’t account for a sizable fraction of Chetty’s findings.
The database of IRS returns that Chetty is working from is unprecedented. Since he’s working with taxpayer records provided at taxpayer expense, I think we owe it to ourselves to think harder than we have about what explains the results he’s come up with.
Or then again, we can continue to focus on more important things, like sports statistics.
Obviously, I’ve killed a lot of time in my life looking at sports statistics, but I’ve actually gotten better at it in thinking about statistics that really matter. In contrast, sports statistics seem to be turning into this kind of Safe Space for White Guys where they can investigate, reason and debate without getting fired for saying the wrong thing.
 Daily Stormer The Most Censored Publication in History


