The New Observer
January 15, 2016
The entire Middle and working class in America—which includes the majority nonwhite lowest 20 percent of the population—is now economically worse off than they were eight years ago, and are steadily getting poorer, according to a new report issued by the Brookings Institution.
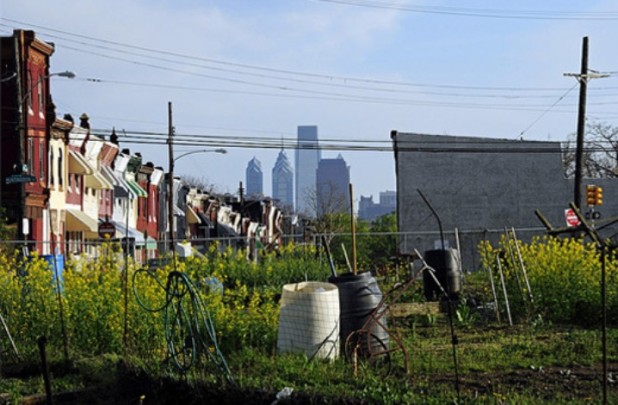
A view of Philadelphia city center from one of the suburbs.
The Washington DC think tank report, aimed at providing an analysis of the wage gap between the richest and poorest elements of society, does not mention race at all.
It is however no secret that that there is a direct correlation between poverty and ethnicity—with the rule being that the more white the community, the better off it is.
However, it is equally important to bear in mind that a large number of ordinary white Americans have been severely impoverished by a combination of factors which include rampant unrestrained capitalist exploitation, poor political leadership, and spiraling social security costs.
With these two important provisos in mind, the Brookings Institution report provides a fascinating insight into the state of the American economy and societal structure.
According to the study, many of the poorest households in America earn just a fraction of what they made before the recession of 2007, even though there was supposedly a “recovery” in 2014 which included “robust job growth.”
Incomes for “the bottom 20 percent” of the population slid in New York City, New Orleans, Cincinnati, Washington, and St. Louis.
Cincinnati, home to such major companies as Procter & Gamble and Macy’s, that are associated with middle class prosperity, saw its bottom 20 percent earn just $10,454 in 2014. After inflation, that is 3 percent less than what they earned in 2013—and 25 percent below their incomes when the recession started eight years ago in 2007.
Cincinnati’s top 5 percent of earners made at least $164,410 in 2014, a figure that has increased since 2013.
“The consequence is a widening income gap,” the report said. The top 5 percent earned 15.7 times what the bottom 20 percent did in Cincinnati. Nationally, this ratio was 9.3—the same as in 2013. Before the recession, the ratio was 8.5.
The analysis also revealed that despite job growth and modest pay raises, millions of Americans have been unable to climb “back up the economic ladder.”
Brookings found that the income gap was highest in Boston, where the top 5 percent made 17.8 times what the bottom 20 percent did.
New Orleans, where pay for the bottom 20 percent also declined, had the second-worst ratio at 17.7. Atlanta came in third-worst at 17.5 and Cincinnati fourth.
“Persistent income disparity” has become increasingly visible in the housing market. Brookings found that the bottom 20 percent of residents in the Washington DC area—who earn just $21,230—would need to spend nearly half their income on housing.
The largest jump occurred in the Jacksonville, Florida metro area. More than 28 percent of its renters devoted half their income to housing in 2014, a share that has increased by a third over the past decade. In Los Angeles and New Orleans, nearly a third of all renters spent the majority of their income on housing.
 Daily Stormer The Most Censored Publication in History


