 Daily Stormer The Most Censored Publication in History
Daily Stormer
April 12, 2014
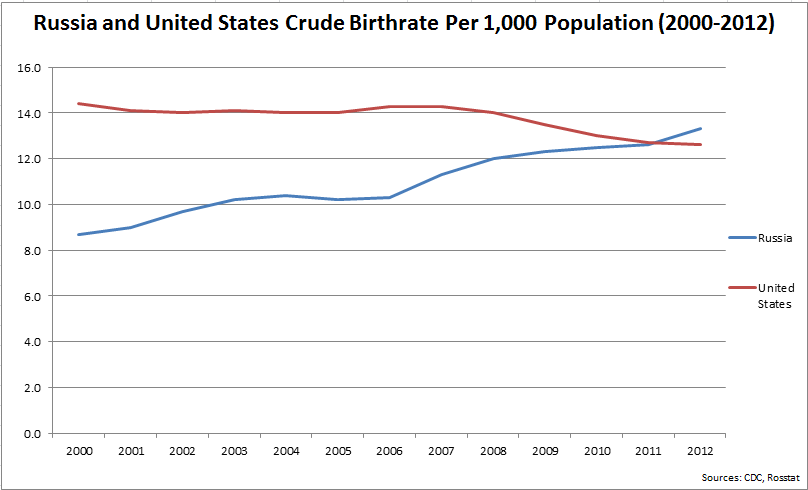
Russia just surpassed us in the birthrate race. This isn’t surprising, as they are a country actively encouraging traditional family values, while we are doing the exact opposite: encouraging homosexuality, free love and abortion.
Please note that this includes our massive (nearly 50%, I’d wager) population of blacks and browns, while Russia remains over 80% White Russian, with the better part of the remaining 20% being White ethnic minorities.
Unfortunately, quite a lot of what gets written about Russia’s demography is pretty simplistic and one-sided. On the rare occaison that someone in the popular press writes about Russian population trends there are usually pretty significant issues with the analysis, and the data that is presented to readers is often out of context or out of date. Because of the country’s (genuinely terrible!) experience during the 1990′s, there’s a deep tendency to view Russia as some sort of freakish outlier: a bizarre dystopia in which people “have lost the will to live” and no longer bother to reproduce. The reality is a lot more complicated, and there have been substantial changes for the better over the past decade.
With the United States the tendency is exactly the opposite: because the US has traditionally had demographics that were much more robust than “old Europe” there’s a tendency to assume that this is still the case. In reality, though, the United States has become much less demographically “ exceptional” among developed countries, and the past few years have seen a significant (if not catostrophic) decrease in births and fertility. The Great Recession might have ended a few years ago, but its demographic consequences are, if anything, intenstifying.
The great thing about demogrpahy is that there are always hard numbers available. Rather than create a lengthy and long-winded analysis of the relevent trends I thought I would simply show two charts that put things nicely in perspective. The first shows the crude birthrate per 1,000 in Russia and the US from 2000-12 (the most recent year for which the CDC has data). Since it’s not adjusted for population composition the CBR is a rather blunt measure, but it nevertheless shows the general trend in births.
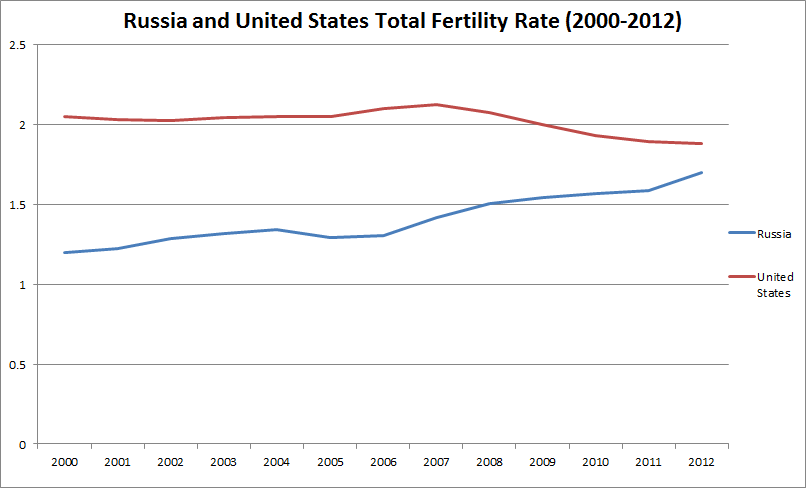
The second graph shows the total fertility rate (TFR) for Russia and the United States between 2000 and 2012. The TFR is a much more instructive measurement because it is adjusted for population composition. While the reality can sometimes be a little messy, in theory a country’s TFR will change only if there is genuine movement in childbearing patterns not if there are proportionally more young or elderly people.
Here are said graphs: